The Journey to Full Context-Sensitive Sampled Profile with ARM ETM and Beyond
This post was not written by AI. All mistakes are mine.
Background
CSSPGO: Context-Sensitive Sample Profile Guided Optimization
CSSPGO is a context-sensitive sampling-based PGO framework with pseudo-instrumentation.1 It’s an advanced form of sampling-based PGO,2 improving upon AutoFDO3 in two important ways: context-sensitive profile, and accurate sample correlation via pseudo instrumentation (probes) instead of debug information.
Pseudo probes can be enabled independently from context-sensitive profile, and used together with autofdo-style flat profile, making it a half-way probe-only CSSPGO. But the focus of this note is full CSSPGO with probes and cs-profile, and specifically how to get the latter on ARM CPUs.
The value proposition of context sensitivity is more accurate inlining. It relies on low overhead sampling-based profiling that provides calling context-qualified execution information. That specifically means synchronized call and branch stack hybrid samples, designed around Intel LBR+PEBS sampling support4 available with Skylake and later CPUs (2015+).
ARM ETM: Embedded Trace Macrocell
On ARM platforms, the closest equivalent profiling capability is BRBE5, introduced with ARMv9.2-A as an optional feature. First CPU cores supporting it are Cortex-A520/A720/X4/X925, and Neoverse V3. As of October 2026, first CPUs with this capability just started appearing, mainly Neoverse V3-based designs such as Graviton V5, Nvidia Vera, and ARM Phoenix (AGI CPU).
This means that for virtually all current (as of Oct 2026) ARM CPUs this profiling extension is not supported. Instead, the most widely available profiling capability that provides a history of last branches on ARM is ETM feature in A-profile CPUs starting with ARMv7-A (Cortex-A8, 2005+).
The caveat is that ETM is a tracing feature, which differs from sampling in several ways but most importantly in profiling overhead and out-of-band tracing nature:2
- Tracing captures orders of magnitude more execution information compared to sampling. To reduce tracing overhead, ETM implements hardware strobing, or autofdo mode,6 making it practical for fleet-wide profiling. Perf has support for synthesizing branch stack samples from strobed traces.
- The downside of out-of-band tracing is that it doesn’t raise PMU interrupts to attach call stack samples to.
Solutions
Partial, pre-existing solutions
It’s worth mentioning that ETM offers ways to collect required profile in some cases:
- Callchain synthesis: the support was proposed in 20207 by Leo Yan but stalled in the review,
revived in Jun this year.8
- For short running workloads or those exhibiting representative behavior from the start, one could trace
first seconds of execution and synthesize synchronized call and branch stack samples via
itracemechanism.9 - For workloads where continuous profiling is impractical, synthesis from strobed profile could still be used. However, this approach only covers calls that occurred within sampled trace, resulting in shallow callchains only covering 1-2 top frames.
- For short running workloads or those exhibiting representative behavior from the start, one could trace
first seconds of execution and synthesize synchronized call and branch stack samples via
- If continuous tracing overhead (memory bandwidth) is acceptable, the trace can be written into circular
buffer and trace snapshots can be attached onto PMU events using
aux-sample10 support. The support was posted by Leo Yan in Sep this year after I started my investigation.
That being said, up until August this year, I deemed it impossible to collect full CSSPGO profile with ETM for the AutoFDO/CSSPGO intended use case: fleet-wide, low-overhead, long-running workloads. Luckily, I was wrong.
Free-running pause and resume
The first discovery was aux-action support that allows pausing and resuming ETM on configurable events:11
Example for triggering AUX pause and resume with ftrace tracepoints:
perf record -e cs_etm/aux-action=start-paused/k \
      -e syscalls:sys_enter_openat/aux-action=resume/ \
      -e syscalls:sys_exit_openat/aux-action=pause/ ls
Example for triggering AUX pause and resume with PMU event:
perf record -a -e cs_etm/aux-action=start-paused/k \
      -e cycles/aux-action=pause,period=10000000/ \
      -e cycles/aux-action=resume,period=1050000/ -- sleep 1
The first example works great because sys_enter and sys_exit are paired perfectly. Not so much with the second example. The example makes it look like it produces traces like this:
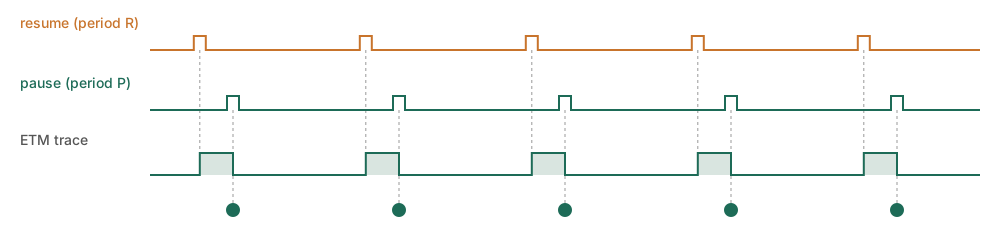
If that was the case, all that would be needed is just making pause event take a call stack snapshot, and adding timestamp anchors to allow “stitching” synthesized branch stacks with samples carrying call stacks.
Unfortunately, the periods for pause and resume events are independent, so the following trace will be produced instead:
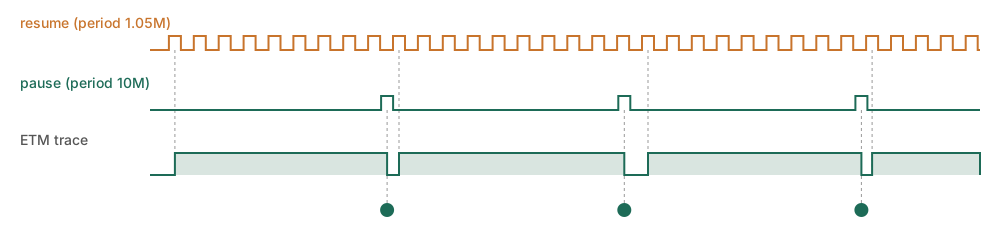
This setup would keep tracing enabled for the majority of the time, since resumes are more frequent than pauses. Swapping periods produces the following waveform:
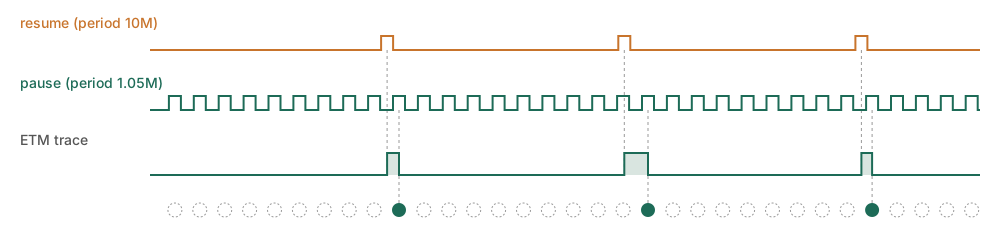
This is better but not ideal still: the tracing windows are shorter, but there are pause events without corresponding resumes, meaning wasted stack snapshots.
I spent some time fiddling with periods and arrived at the following setup:
perf record -T \
  -e cs_etm/aux-action=start-paused,timestamp/u \
  -e cpu_cycles/aux-action=resume,period=8338447/u \
  -e cpu_cycles/aux-action=pause,period=100003,call-graph=fp/u
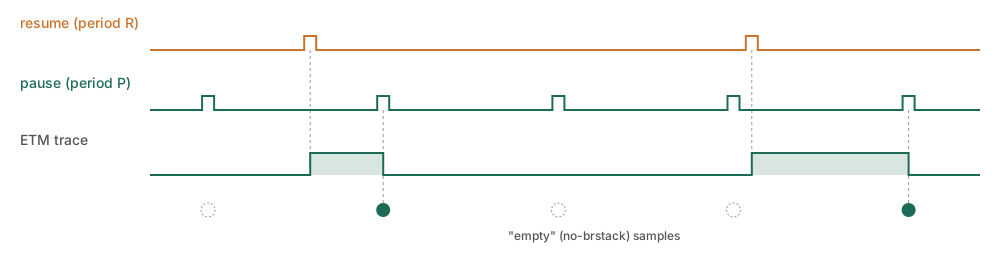
Timestamps are needed for “stitching” synthesized branch stacks with PMU events and attaching them to existing events carrying call stacks12 (not in mainline perf as of Oct 2026).
Important notes about this setup:
- Resume period (R) must be longer than pause (P).
- R and P must be aperiodic to avoid zero-length windows that trip perf.
- Use golden ratio: set
R mod Pto about0.618*Pto spread the resume phase evenly to quickly get average window at half thePand avoid short windows. P/Ris the fraction of pause samples that carry branch history,P/2Ris the average ETM-on duty.
The last line shows how terribly inefficient this scheme is: vast majority of pause samples don’t have a trace,
but do take a callstack snapshot. So to get a viable profile, kernel.perf_cpu_time_max_percent needs to be raised
(defaults to 25%). It was clear that a better solution is needed.
Staggered pause
Waveforms above make it clear that what we actually need is the same period on two events, but the pause events need to be staggered, or offset by configured window duration from resume events. Unfortunately, there was no mechanism in perf or kernel to get that.
Userspace stagger
But if we dig deeper, the key finding is PERF_EVENT_IOC_PERIOD ioctl:13
PERF_EVENT_IOC_PERIOD
    This updates the overflow period for the event.

    Since Linux 3.7 (on ARM) and Linux 3.14 (all other
    architectures), the new period takes effect immediately.
    On older kernels, the new period did not take effect until
    after the next overflow.
To achieve staggered events, its post-3.14 behavior requires correctly timing it. I prototyped this as
--aux-action-stagger perf option, as a userspace-only solution. This approach works and produces low-overhead synchronized call and branch stack sampling as intended.
How staggering events on a given CPU ("arming") works
- Perf opens both action events with a large guard period (doesn’t expire).
- In system-wide mode, perf pins itself to each CPU in turn and restarts the resume counter with period T.
- Runs busy-wait to advance the count until W is reached.
- Restart pause counter with period T.
- From that point, both events count the same event with the same period.
The code staggering events is large because it tries to do the atomic kernel-side action in the userspace. It also comes with significant limitations:
- It’s invasive: busy loop competes with the workload,
- No pid or cgroup targeting,
- Supported events are restricted to those advanced by a busy loop (cycles, instructions).
So as is, I found it too ugly for upstreaming into perf.
Kernel stagger
It’s interesting to note that old PERF_EVENT_IOC_PERIOD behavior would make staggering events trivial.
How it would have worked:
- Open resume event with period T (without starting it),
- Open pause event with first staggered period T+W,
- Change second and subsequent pause periods to T using ioctl,
- Enable the group, both counters start together on every CPU.
I did a bit of digging to understand why the behavior was changed
ARM: 7556/1: perf: fix updated event period in response to PERF_EVENT_IOC_PERIOD, by Will Deacon, 2012 (v3.7)
This patch changes the calculation of the remaining event ticks so that they are offset if the period has changed.
perf: Fix PERF_EVENT_IOC_PERIOD to force-reset the period by Peter Zijlstra, 2013 (v3.14):
Vince Weaver reports that, on all architectures apart from ARM, PERF_EVENT_IOC_PERIOD doesn’t actually update the period until the next event fires. This is counter-intuitive behaviour and is better dealt with in the core code.
This patch ensures that the period is forcefully reset when dealing with such a request in the core code. A subsequent patch removes the equivalent hack from the ARM back-end.
To me, immediate vs deferred behavior is a matter of choice. Sadly, nobody locked in this deferred period change back then, so here we are.
It’s easy to see where it’s going: moving the stagger back into the kernel solves issues of userspace stagger.
Of course, the tradeoff is a kernel change. For the purposes of setting the stagger in a surgical way, the best
primitive is a first_period perf_event attr.
Why perf_event_attr.first_period
- Per-thread mode: the ioctl way changes one event fd, so children would need their own ioctl. For an attr field, inherited events get a copy, so stagger works from the start.
- Set from the start: no window has the wrong size.
- Cons: adding a new field is a PERF_ATTR_SIZE_VER change, which is probably heavier than a new (old) ioctl.
If stagger use-case doesn’t motivate a version bump, then there are two ways forward with an ioctl:
- Return deferred (pre-3.7/3.14) behavior as
IOC_NEXT_PERIOD, - Introduce a new, more direct and general ioctl
IOC_PERIOD_LEFTthat setsperiod_left.
I also prototyped this but yet to submit a patch. In addition to kernel interface, this would need to be exposed in perf, making it a heavier-weight change compared to the one below.
HW stagger: Claude’s breakthrough
While working on software-only solutions, one idea kept coming back to me: how can we leverage HW strobing mode? At about that time, Claude Opus 5.5 was released, and I asked it to research this idea.
And research it did.
Claude found that hardware strobing can also drive external outputs that are exposed as PMU events on recent ARM cores (Neoverse N2/V2/N3/V3, Cortex-A520/X925):
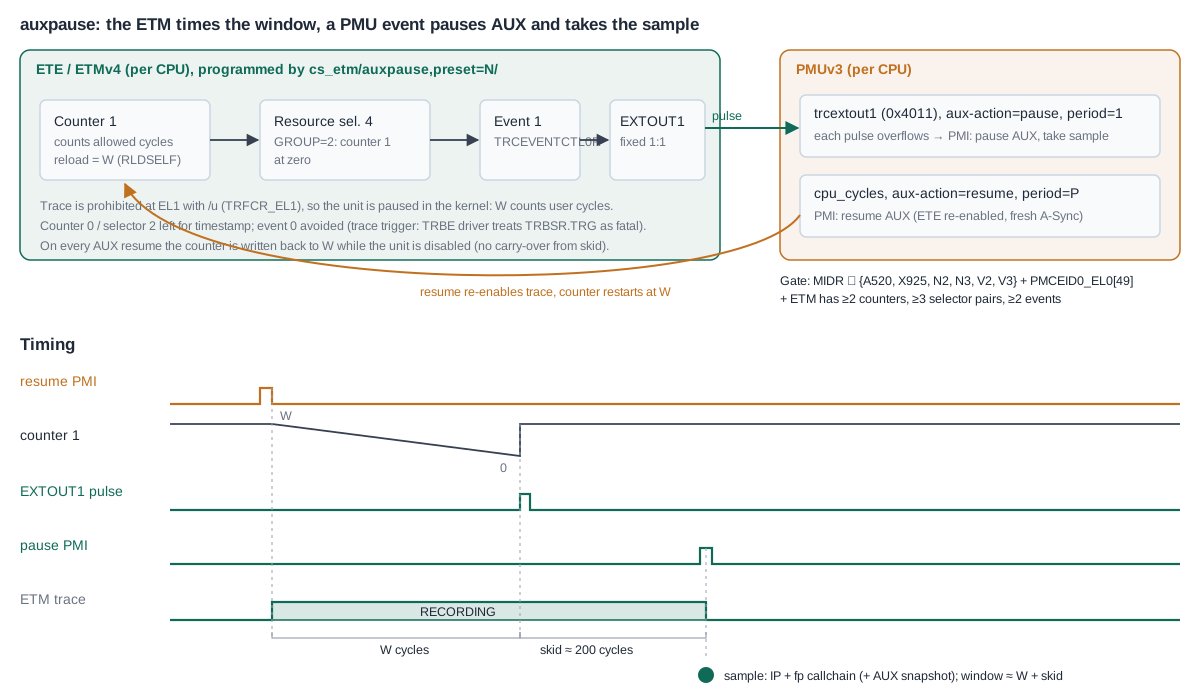
I simplified this further to a config that simply pulses a TRCEXTOUT1 PMU event,14 making it effectively
“unhalted ETM cycles”, also subject to any filtering applied (e.g. userspace cycles only). It then can be used as pause
event:
perf record -T \
  -e cs_etm/pmu_pulse,aux-action=start-paused,timestamp/u \
  -e cpu_cycles,aux-action=resume,period=1050031/u \
  -e armv8_pmuv3_0/trcextout1,aux-action=pause,period=1000,call-graph=fp/u \
  -- ./workload
This finally achieves the waveform expected from the example from the beginning of this section.
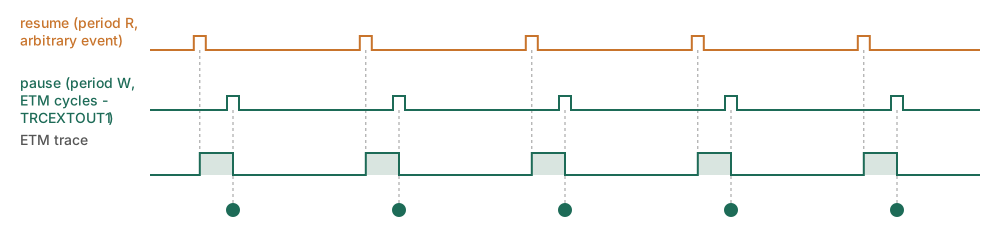
(As an honorable mention, I used Meta’s Muse agent to look up ARM’s TRMs to find which cores have ETE external outputs as
PMU TRCEXTOUT* events.15)
The major benefit of this approach is that it’s a config-only change (plus a CPU check that can be omitted). The config itself could also be loaded from a separate kernel module without the CPU check.
But taking a step back, the reason for using ETM cycles over CPU cycles (or any other PMU event) for pauses in the first place is accidental: it’s just one way to get fixed-count event overflows.
Recap
At the time of writing (Oct 2026), pmu-pulse is the recommended setup for CPUs that expose ETE outputs as TRCEXTOUT.
For CPUs that don’t, there is now a range of solutions for staggered pauses and resumes:
- in userspace perf,
- in kernel, also need perf interface:
perf_event_attr.first_period+ attr version bump,IOC_PERIOD_LEFTioctl.
Improvements roadmap
During the investigation, I found potential improvements that might be of interest to the wider perf community.
Flexible pause/resume via aux-action
To move from same-event stagger to flexible choice of events for pauses and resumes, the missing piece is resetting pause event counter from a resume event handler.
This can be controlled by a per-event attr bit and exposed in perf e.g. as aux-action=pause-after-resume:
perf record \
  -e cs_etm/aux-action=start-paused/u \
  -e cpu_cycles/aux-action=resume,period=8000000/u \
  -e armv8_pmuv3_0/br_retired,aux-action=pause-after-resume,period=100,call-graph=fp/u \
  -- ./workload
Resetting pause event on resume
Inside resume overflow handler:
- Locate pause event group sibling,
- Stop it,
- Reset its
period_leftto sample period, - Restart it.
This has the best flexibility in terms of events for pauses and resumes, and can also be used for Intel PT.
Faster decoding
Another important dimension for CSSPGO is profile collection overhead. For ETM, this includes both recording and decoding. HW stagger minimizes the record overhead via short trace windows, so the remaining part is the trace decoding.
Skipping loading symbols
For the purposes of CSSPGO profile conversion, perf script only needs to output unsymbolized call and branch stacks.
However, DSO symbol loading happens unconditionally and constitutes the bulk of the overhead for small perf data files
(not decode-bound). As a reference point, for 10s cs_etm/autofdo captures of Python busy loops and Clang compilations,
skipping it makes decode 10-30x faster and reduces peak RSS by ~100x.
The work is ongoing to make symbol table loading automatic depending on requested perf script fields.
Decode caching
perf has support for Intel PT decode caching. OpenCSD code walker can be taught to use it. This improvement was measured to bring ~25% faster decoding, on top of the improvement above.
Compiler optimizations
Decoding is a control flow-heavy task, which lends itself to compiler optimizations. With perf built with ThinLTO/CSSPGO/BOLT, this leads to another ~25% faster decode, compared to a Clang O3 baseline.
Integration with aux-sample
aux-sample10 mode attaches trace buffers to perf samples directly, which avoids the need for timestamp stitching.
As currently posted, tracing needs to be running continuously for hybrid sampling: otherwise samples may fall on trace
discontinuities and produce bogus branch histories.
But aux-sample support can be combined with any solution mentioned above for shorter captures and more efficient decode.
The support for attaching synthesized branch stacks onto existing samples (itrace=L)12 currently doesn’t check for
aux-sample mode (was posted before aux-sample was added).
Online BPF ETM profiler
All the improvements mentioned above make tracing and decoding very efficient to the point of being online: meaning decoding can keep up with tracing, with both using a fraction of a single CPU. This is where performance unlocks new capability: keeping the trace entirely in memory, avoiding writing to perf.data file.
That, in turn, makes something incredible possible: a BPF ETM profiler. BPF gained support for profiling a decade ago:
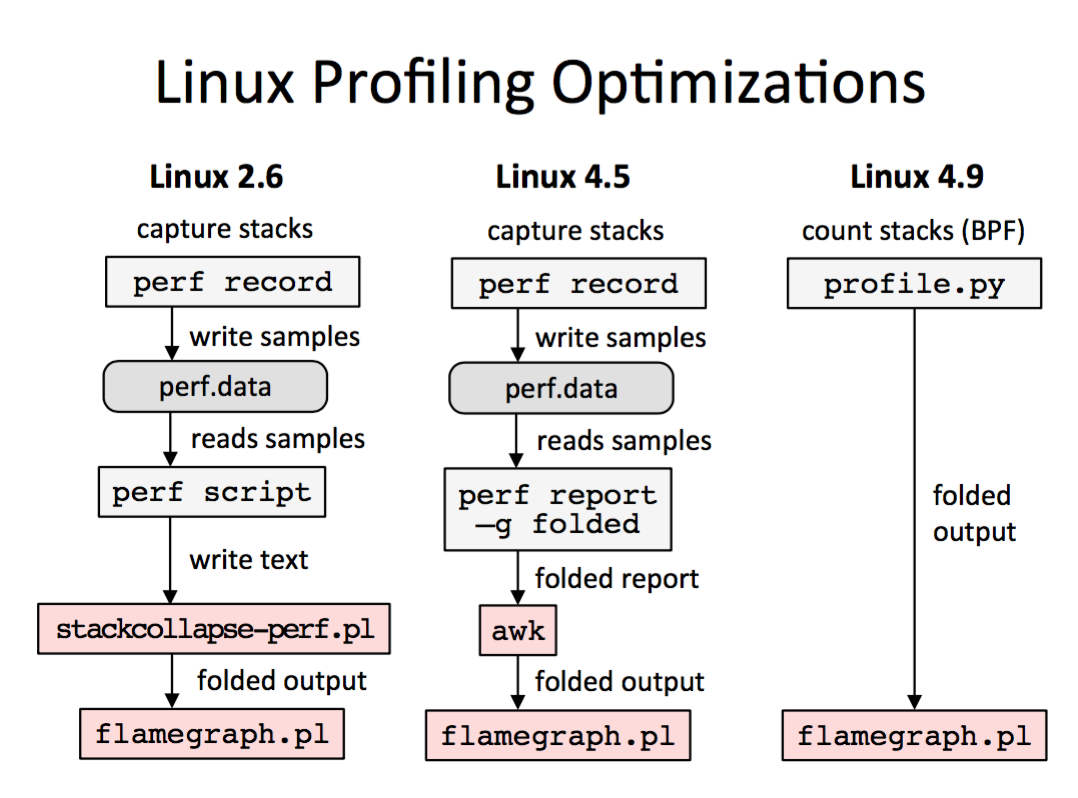
Brendan Gregg’s BPF for profilers slide16
BPF is used in many (most?) profilers these days, including at Meta17 and Yandex,18 to name a few.
Branch stack sampling support in BPF enables low-cost PGO and BOLT profiling19 on supported CPUs. BRBE support is expected to be added soon.20 On CPUs without BRBE, AUX support in BPF fills the gap.
BPF brstack ETM profiler
Operation:
- open cs_etm group with pause/resume events directly,
- decode trace windows online (using cached OpenCSD instruction walker),
- BPF helpers on pause and resume events:
- pause: takes a stack snapshot with
bpf_get_stackand trace snapshot withbpf_perf_event_aux_read, - resume: filter by profiling target, moving filtering before the trace is written, not after decoding.
- pause: takes a stack snapshot with
Kernel support needed:
- PMU
read_aux()that exposes AUX buffer to the overflow handler (needs AUX sampling support), - “skip resume” support,
- kfuncs exposing this to BPF:
bpf_perf_event_{aux_read,aux_size,skip_aux_resume}
Stay tuned for the patches.
CSSPGO appendix
Skid
The reason CSSPGO required PEBS is the need for synchronized call and branch stacks.21 ETM doesn’t provide zero-skid guarantees, so the hybrid samples it produced had to be validated. Until recently, CSSPGO profile conversion tool (profgen) had faulty validation of samples, which was fixed as part of this investigation.22
The results show low percentage of bogus samples, usually within 1-2%, making the profile suitable for optimizations.
Performance evaluation observations
Context-sensitive profile is primarily useful for better/more selective inlining. This means for workloads where the compiler can’t inline all hot code, large in both codebase and code footprint.
BOLT heatmap reporting of code working set at cache line, base page, and huge page/region granularities23 was helpful in teasing apart the effect of cs profile.
Acknowledgements
Leo Yan and James Clark have been instrumental in this investigation, providing baseline support for ETM in perf and kernel, promptly responding to my requests, and insightful discussions.
References
-
Wenlei He, Hongtao Yu, Lei Wang, and Taewook Oh. 2024. Revamping Sampling-Based PGO with Context-Sensitivity and Pseudo-instrumentation. In Proceedings of the 2024 IEEE/ACM International Symposium on Code Generation and Optimization (CGO ‘24). IEEE Press, 322–333. ↩
-
Dehao Chen, David Xinliang Li, Tipp Moseley. 2016. AutoFDO: Automatic Feedback-Directed Optimization for Warehouse-Scale Applications. CGO 2016 Proceedings of the 2016 International Symposium on Code Generation and Optimization, ACM, New York, NY, USA, pp. 12-23. ↩
-
Denis Bakhvalov. 2018. Advanced profiling topics. PEBS and LBR. ↩
-
Leo Yan. Feb 2020. perf cs-etm: Support thread stack and callchain. ↩
-
Leo Yan. Jun 2026. perf cs-etm: Synthesize callchains for instruction samples. ↩
-
Leo Yan. Sep 2026. CoreSight / perf: Support AUX sampling. ↩ ↩2
-
Leo Yan. 2025. CoreSight - Perf. Fine-grained tracing with AUX pause and resume. ↩
-
Amir Ayupov. Aug 2026. perf: Add CoreSight branch history to existing samples. ↩ ↩2
-
Amir Ayupov. Sep 2026. coresight: Add pmu_pulse/extout_pulse. ↩
-
Amir Ayupov. Sep 2026. coresight: etm4x: Report whether the PMU counts external output 1. ↩
-
Brendan Gregg. 2016. Linux 4.9’s Efficient BPF-based Profiler. ↩
-
Jordan Rome. 2025. Strobelight: A profiling service built on open source technology. ↩
-
Amir Ayupov. 2023. ebpf-bolt: eBPF tool to collect BOLT profile. ↩
-
Puranjay Mohan. May 2026. arm64: Add BRBE support for bpf_get_branch_snapshot(). ↩
-
Denis Bakhvalov. 2018. Understanding performance events skid. ↩
-
Amir Ayupov. Aug 2026. [llvm-profgen] Fix bogus trace check. ↩
-
Amir Ayupov. Aug 2026. [BOLT] Report working set size from the heatmap. ↩